U.S. policy rates closer to peak than in Europe
While the news of improving inflation seems to have rekindled optimism, particularly on the stock markets, the battle to bring inflation back in line with the central banks' target is not over yet.
The Bank of Canada raised its policy rate by 25 bps to 5% in July. The Fed also hiked by 25 bps as expected, to the highest level in 22 years. In the latest announcement, however, Fed Chairman Powell did acknowledge the strength of the economy and the better-than-expected inflation data. In the press conference, Powell also revealed the Fed’s considerations and readiness to begin monetary easing if and when conditions warrant, indicating the central bank’s resolve in lowering inflation while trying to lower the damage to the economy in the process.
The ECB also hiked 25 bps as expected. Europe is farther behind on their tightening cycle as inflation rates are still much higher than tolerable levels, while interest rates in the US are likely near peak in this tightening cycle.
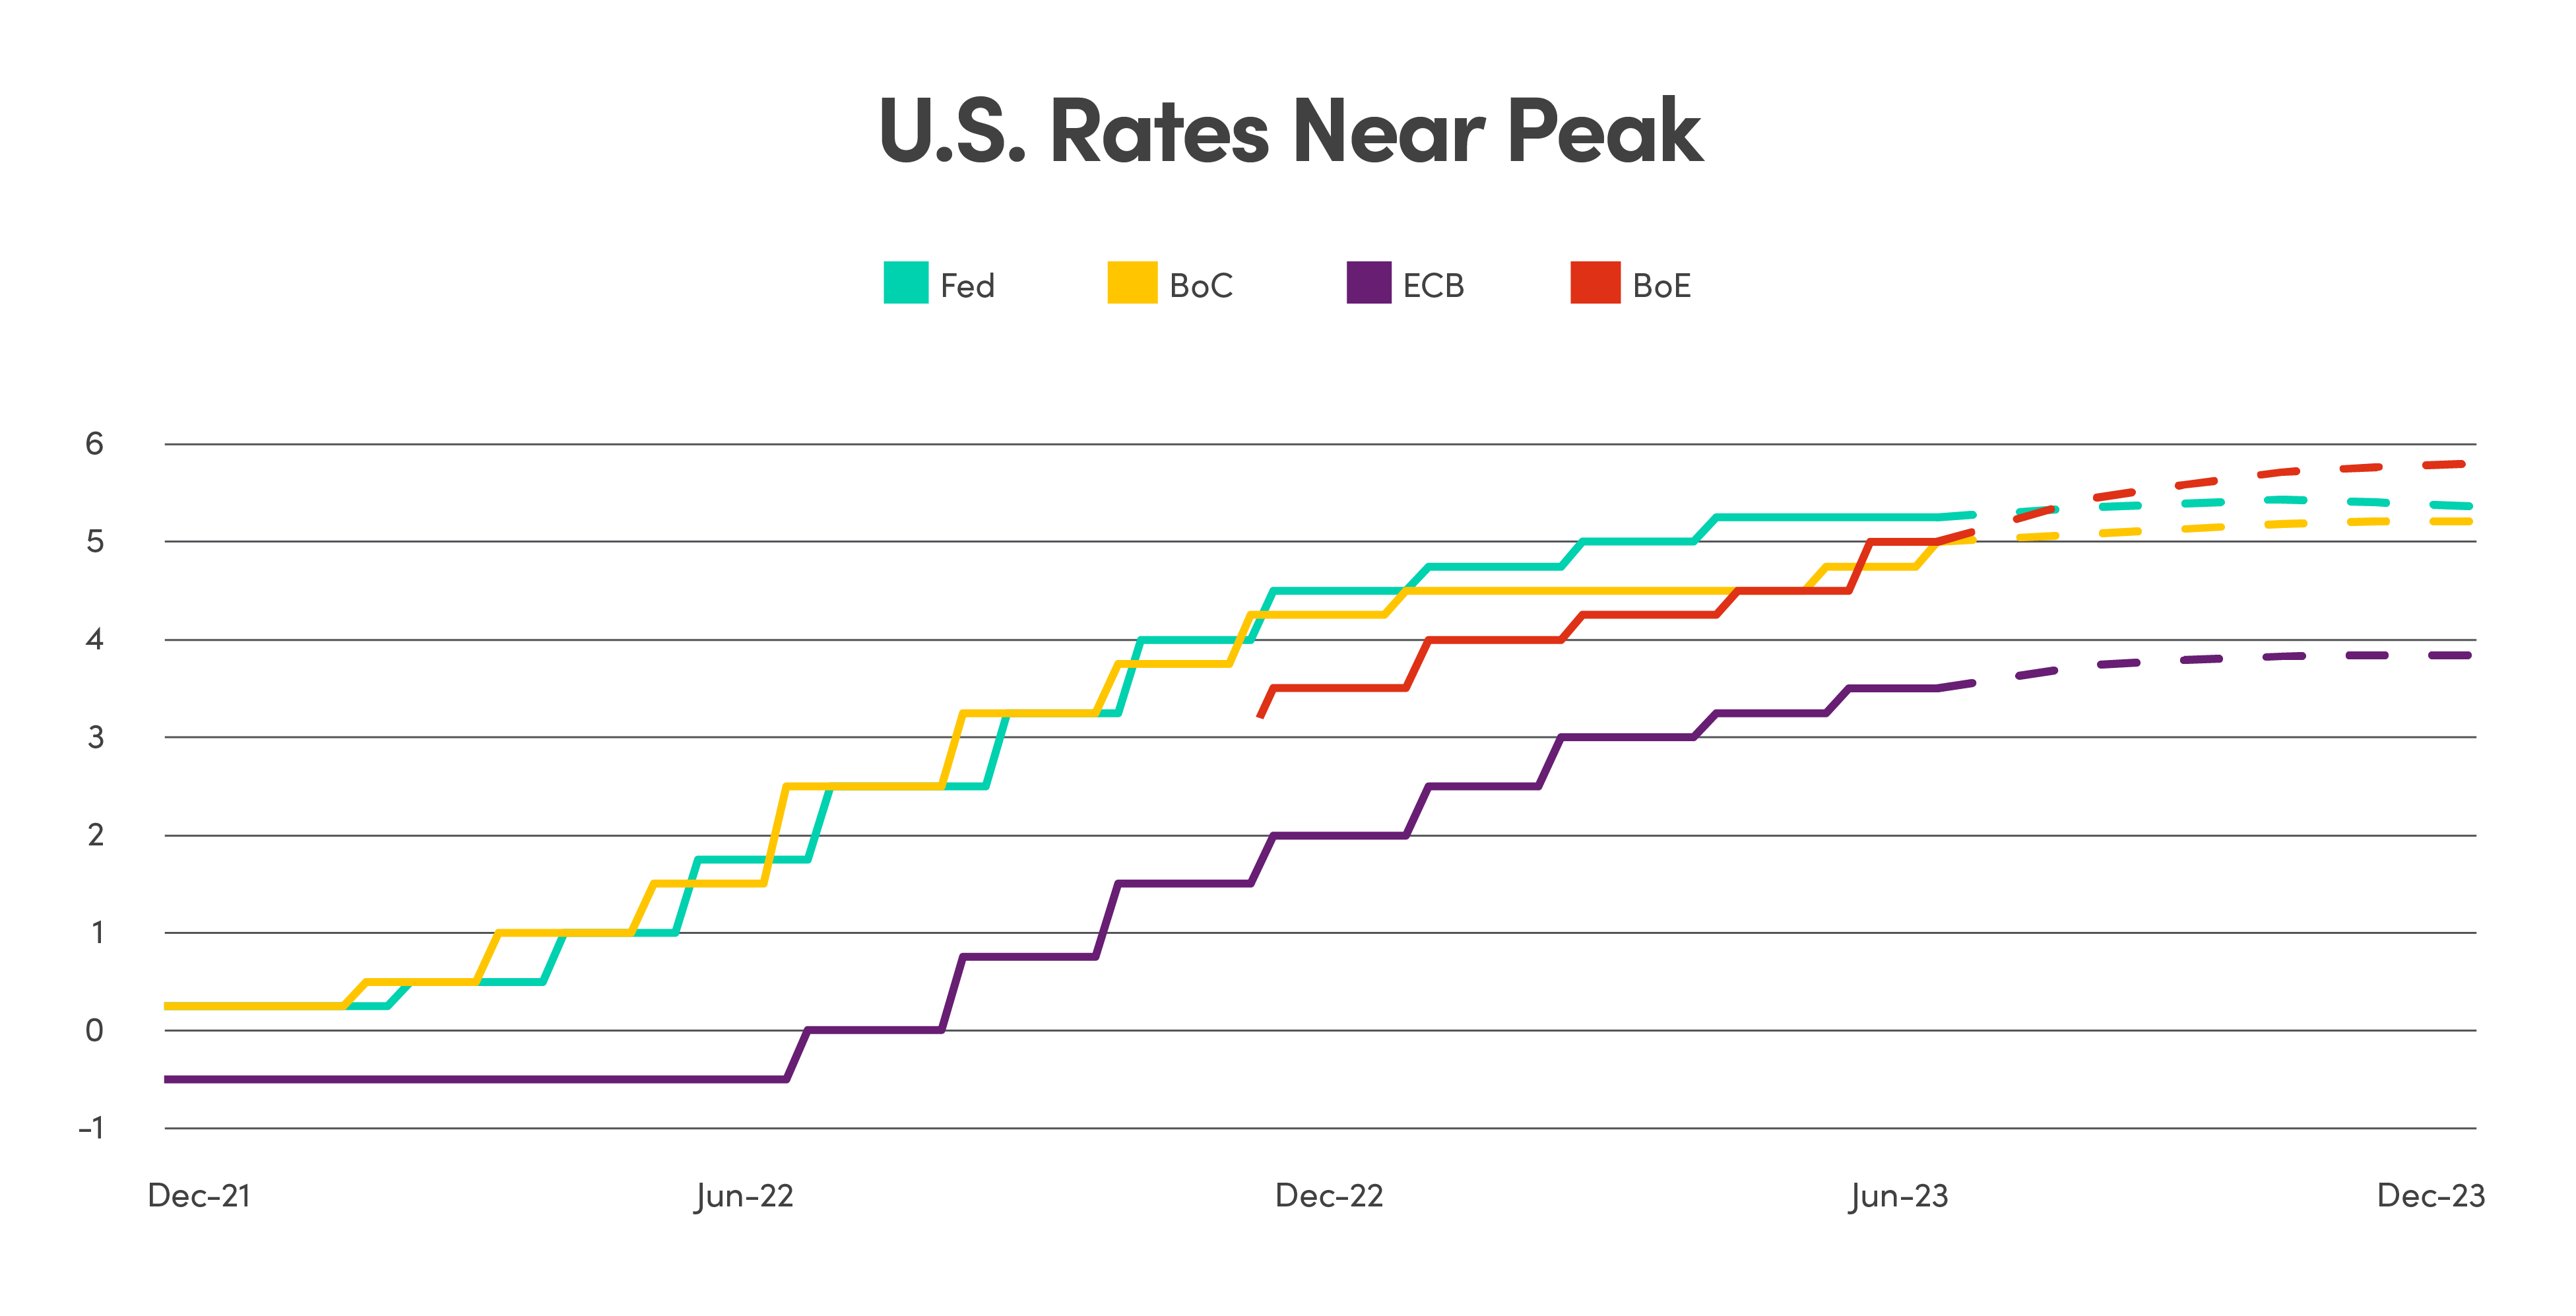
Source: Bloomberg data as of July 31, 2023
Inflation moderating and risks resurgence
Inflation is softening and reaching the lowest levels since the peak inflation a year ago. In the U.S., Canada and U.K., inflation has surprised to the downside suggesting that the central banks’ policies may be starting to curtail the worst of inflation. Long-term inflation expectations have also returned close to the neutral rate between 2-3%.
However, we’re not out of the woods yet and could see inflation rebound moderately higher in the near term:
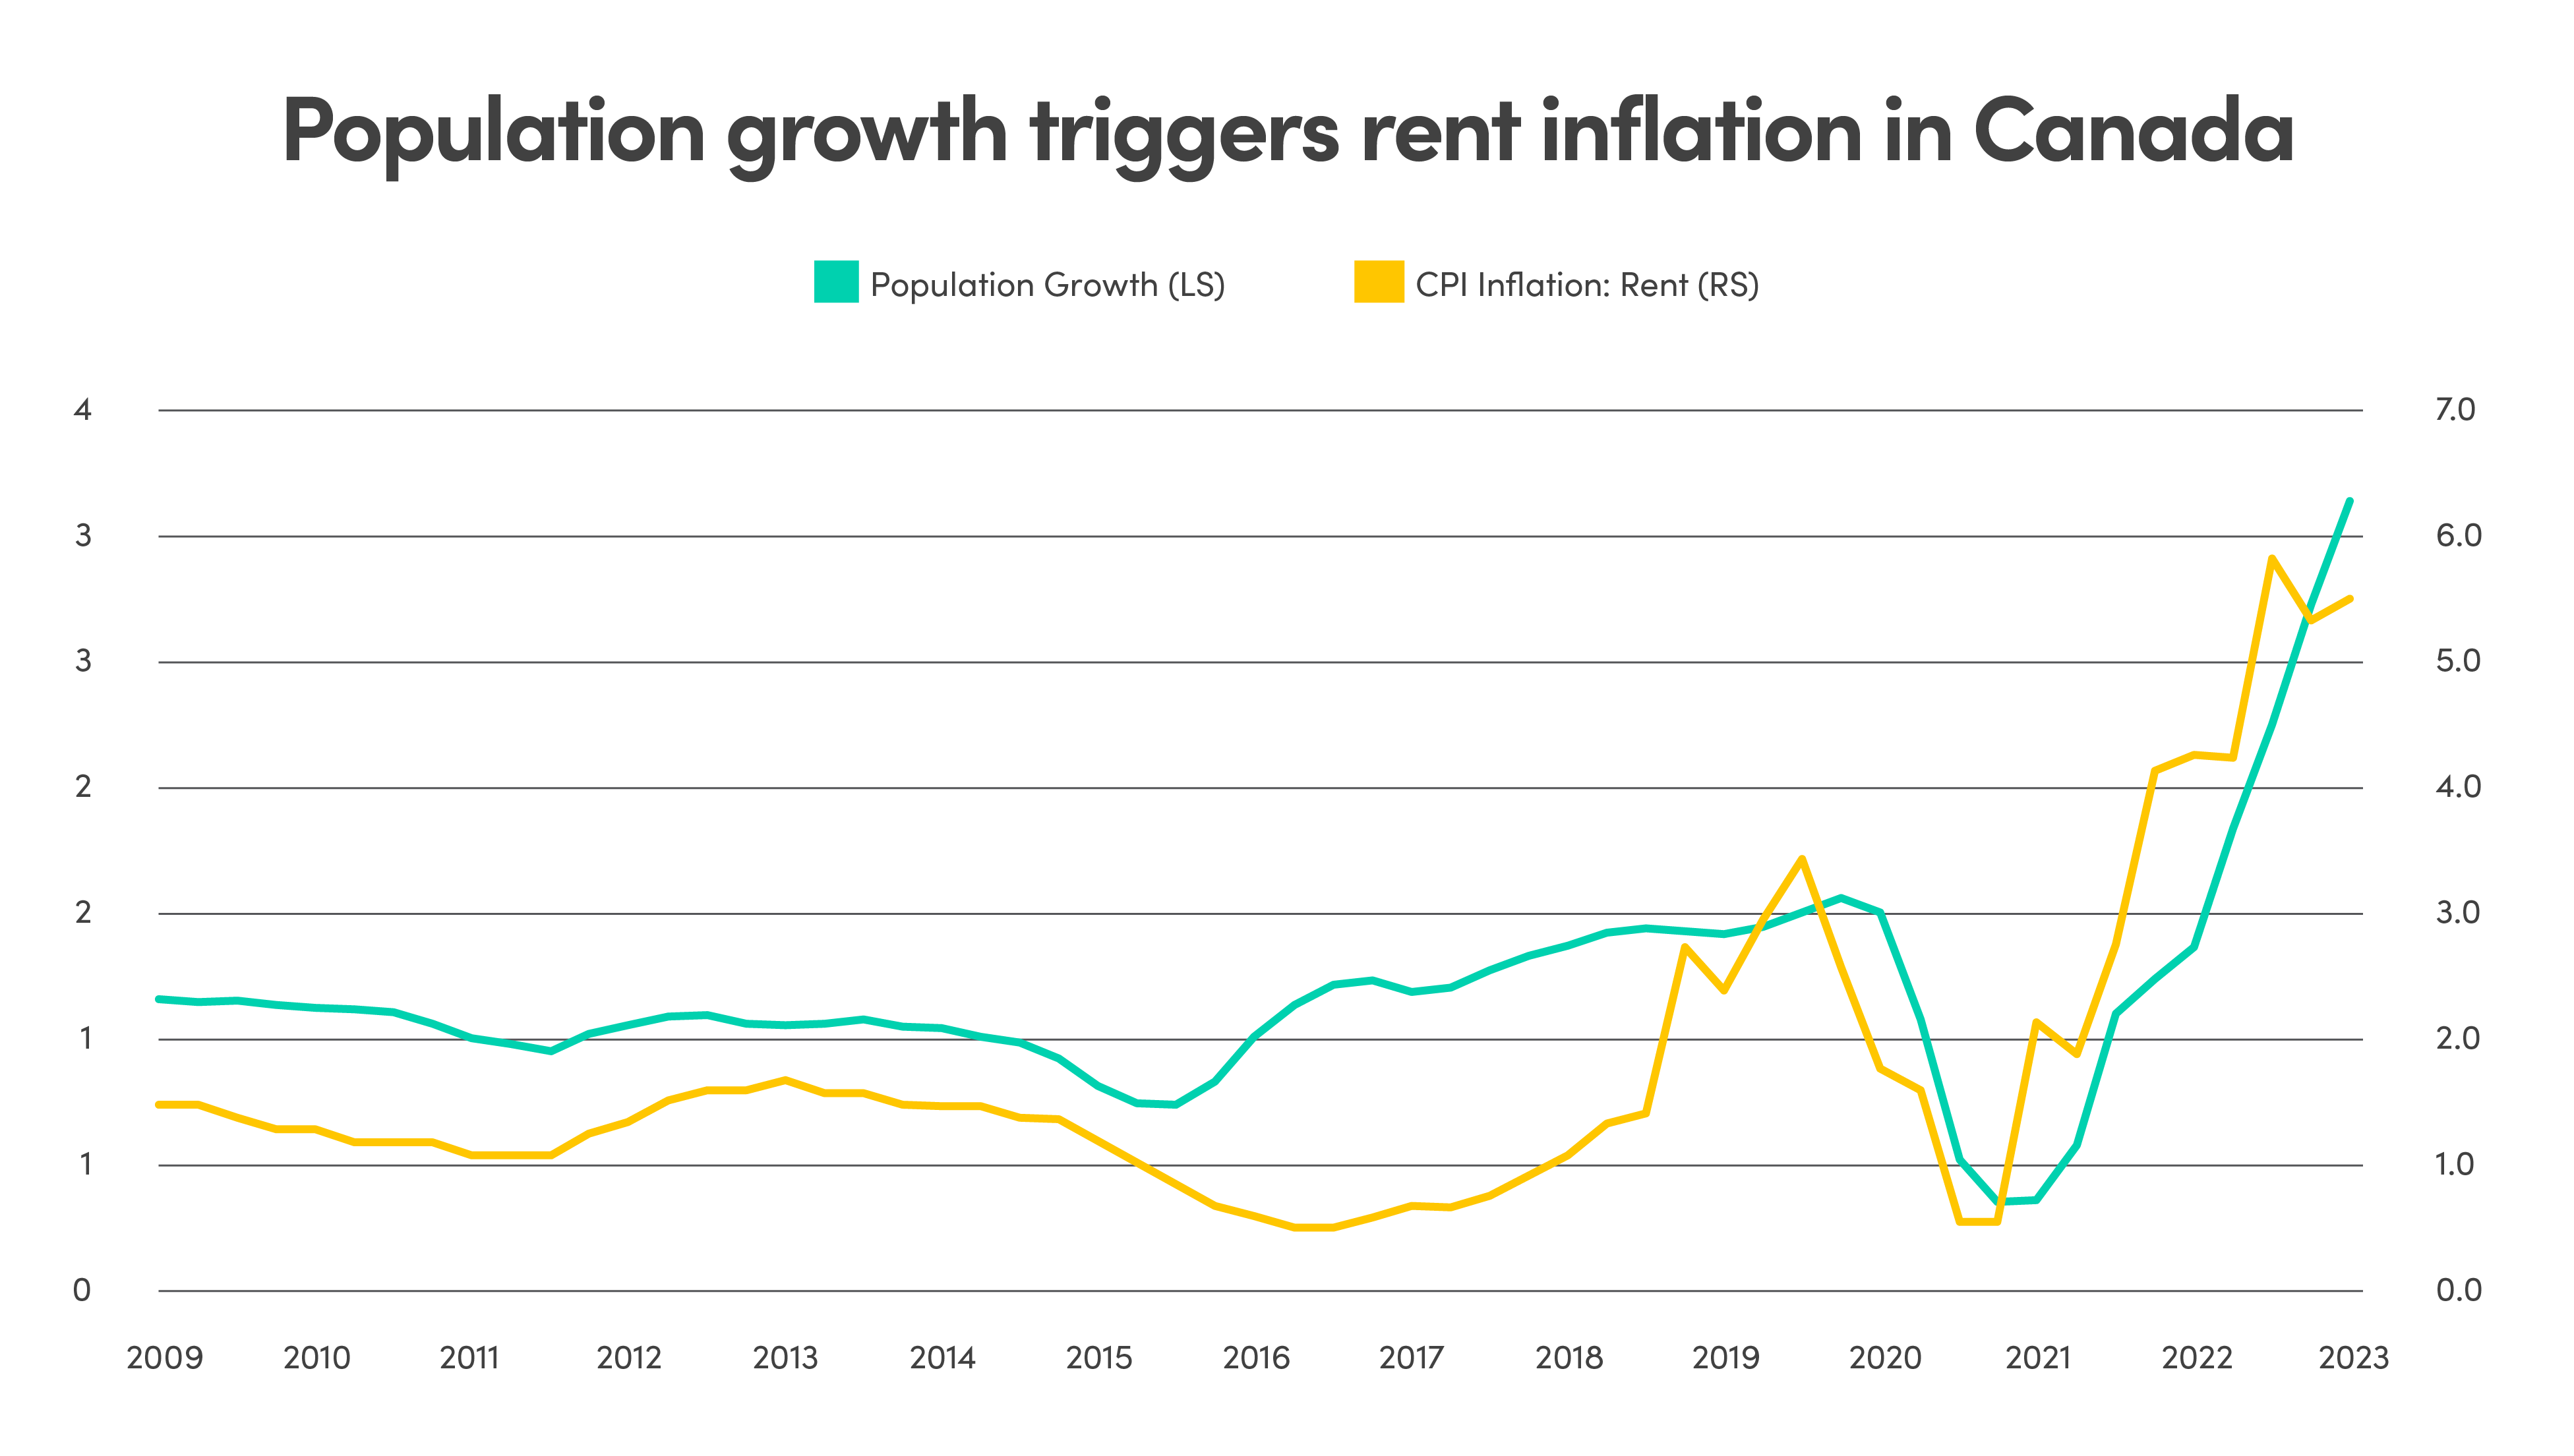
Source: Source: Bloomberg data as of July 31, 2023
Index valuation not representative of the market
The S&P 500 Index has hit the highest concentration level in recent history with top 10 companies surpassing 30% in weighting. With triple-digit year-to-date gains, these largest companies have contributed over 75% of the index’s YTD gains.
While the eye-popping returns of the mega cap companies are taking all the attention, what goes unnoticed is the significant dispersion in valuations between the top 7 companies and the remaining 493. The market as a whole may look expensive and stretched on a valuation basis, but this is mainly driven by the largest 7 stocks. Valuations of the remaining 493 companies are in line with historical average.