Yep, we use cookies for security purposes and to improve your website experience. Who doesn’t right? By continuing to use the site, you agree to the use of cookies as described on our Privacy page. You can reject cookies by changing your browser settings.

Privacy policy

Monthly Market Insights

Markets tread water amid growth and inflation uncertainty

There isn’t much evidence of a looming recession, but the debate about whether the central banks can achieve a soft landing continues. Economic growth remains positive albeit at anemic levels. Strength in the labour market makes a strong argument that we’re in for a gentle touchdown. Inflation, however, remains significantly above target with pressure coming from wage and shelter inflation.

Equity markets had a positive month as the S&P 500 was up 1.8% in April, bringing its year-to-date returns to 9.3%, while the Nasdaq was up 0.25% for the month. Equity markets were up across in the board in Europe, the U.K, Canada, and Japan, while China and Emerging market equities were down for the month. While fixed income markets also ended the month positively. U.S. and Canadian 10-year yields gyrated by more than 30bps to end the month about 10bps lower. Global fixed income index returned 0.5%, while the Canadian fixed income index was up by 1.0%.

The NEI perspective

Recession? What recession? Despite many expecting a hard landing as the predictable outcome of aggressive tightening policy, the April U.S. unemployment figures and other strong economic data makes it difficult to see a recession in the near-term, though tightening financial conditions could still impact markets.

Earnings beat gloomy expectations as 53% of S&P 500 companies that reported results by the end of April, 79% of them reported a positive earnings per share (EPS) surprise and 74% reported a positive revenue surprise. The actual decline in earnings was 3.7%, vs estimated earnings decline at 6.7%.

Index concentration is at record levels thanks to mega cap companies’ outsized impact on the index. The top seven mega cap stocks have accounted for nearly 90% of the S&P’s 2023 gains. For perspective, the 10 largest stocks in the S&P 500 now make up 28.7% of the total weight of the index.

From NEI’s Monthly Market Monitor for April.

Bar graph showing % return in CAD (C$) for equity. Canada monthly return is 3.20% and YTD is 7.52%. US monthly return is 1.46% and YTD is 9.04%. International markets monthly return is 3.05% and YTD is 11.64%. Emerging markets monthly return is -0.92% and YTD is 2.88%

Canada: MSCI Canada; U.S.: MSCI USA; International markets: MSCI EAFE; Emerging markets: MSCI Emerging Markets. Source: Morningstar Direct

Bar graph showing % return in CAD (C$) for fixed income and currency. Canada investment grade monthly return is 0.97% and YTD is 4.07%. Global investment grade monthly return is 0.47% and YTD is 3.24%. US high yield monthly return is 0.96% and YTD is 4.41%. US$ vs C$ monthly return is 0.22% and YTD is 0.10%

Canada investment grade: Bloomberg Barclays Canada Aggregate; Global investment grade: Bloomberg Barclays Global Aggregate; U.S. high yield: Bloomberg Barclays U.S. High Yield. Source: Morningstar Direct.

Hot labour market casts doubts on looming recession

The April U.S. employment data released shows that the labour market continues to be strong as with job gains of 253K, bringing the unemployment rate down further to 3.4% from 3.5%, a multi-decade low. There was a moderate uptick in jobless claims as they rose to 242k from 229k. This small increase, along with the drop in the unemployment rate, are not consistent with onset of a recession and will continue to put pressure on inflation over the medium term.

Graph showing the global Supply Chain Pressure Index from 2014 to 2022

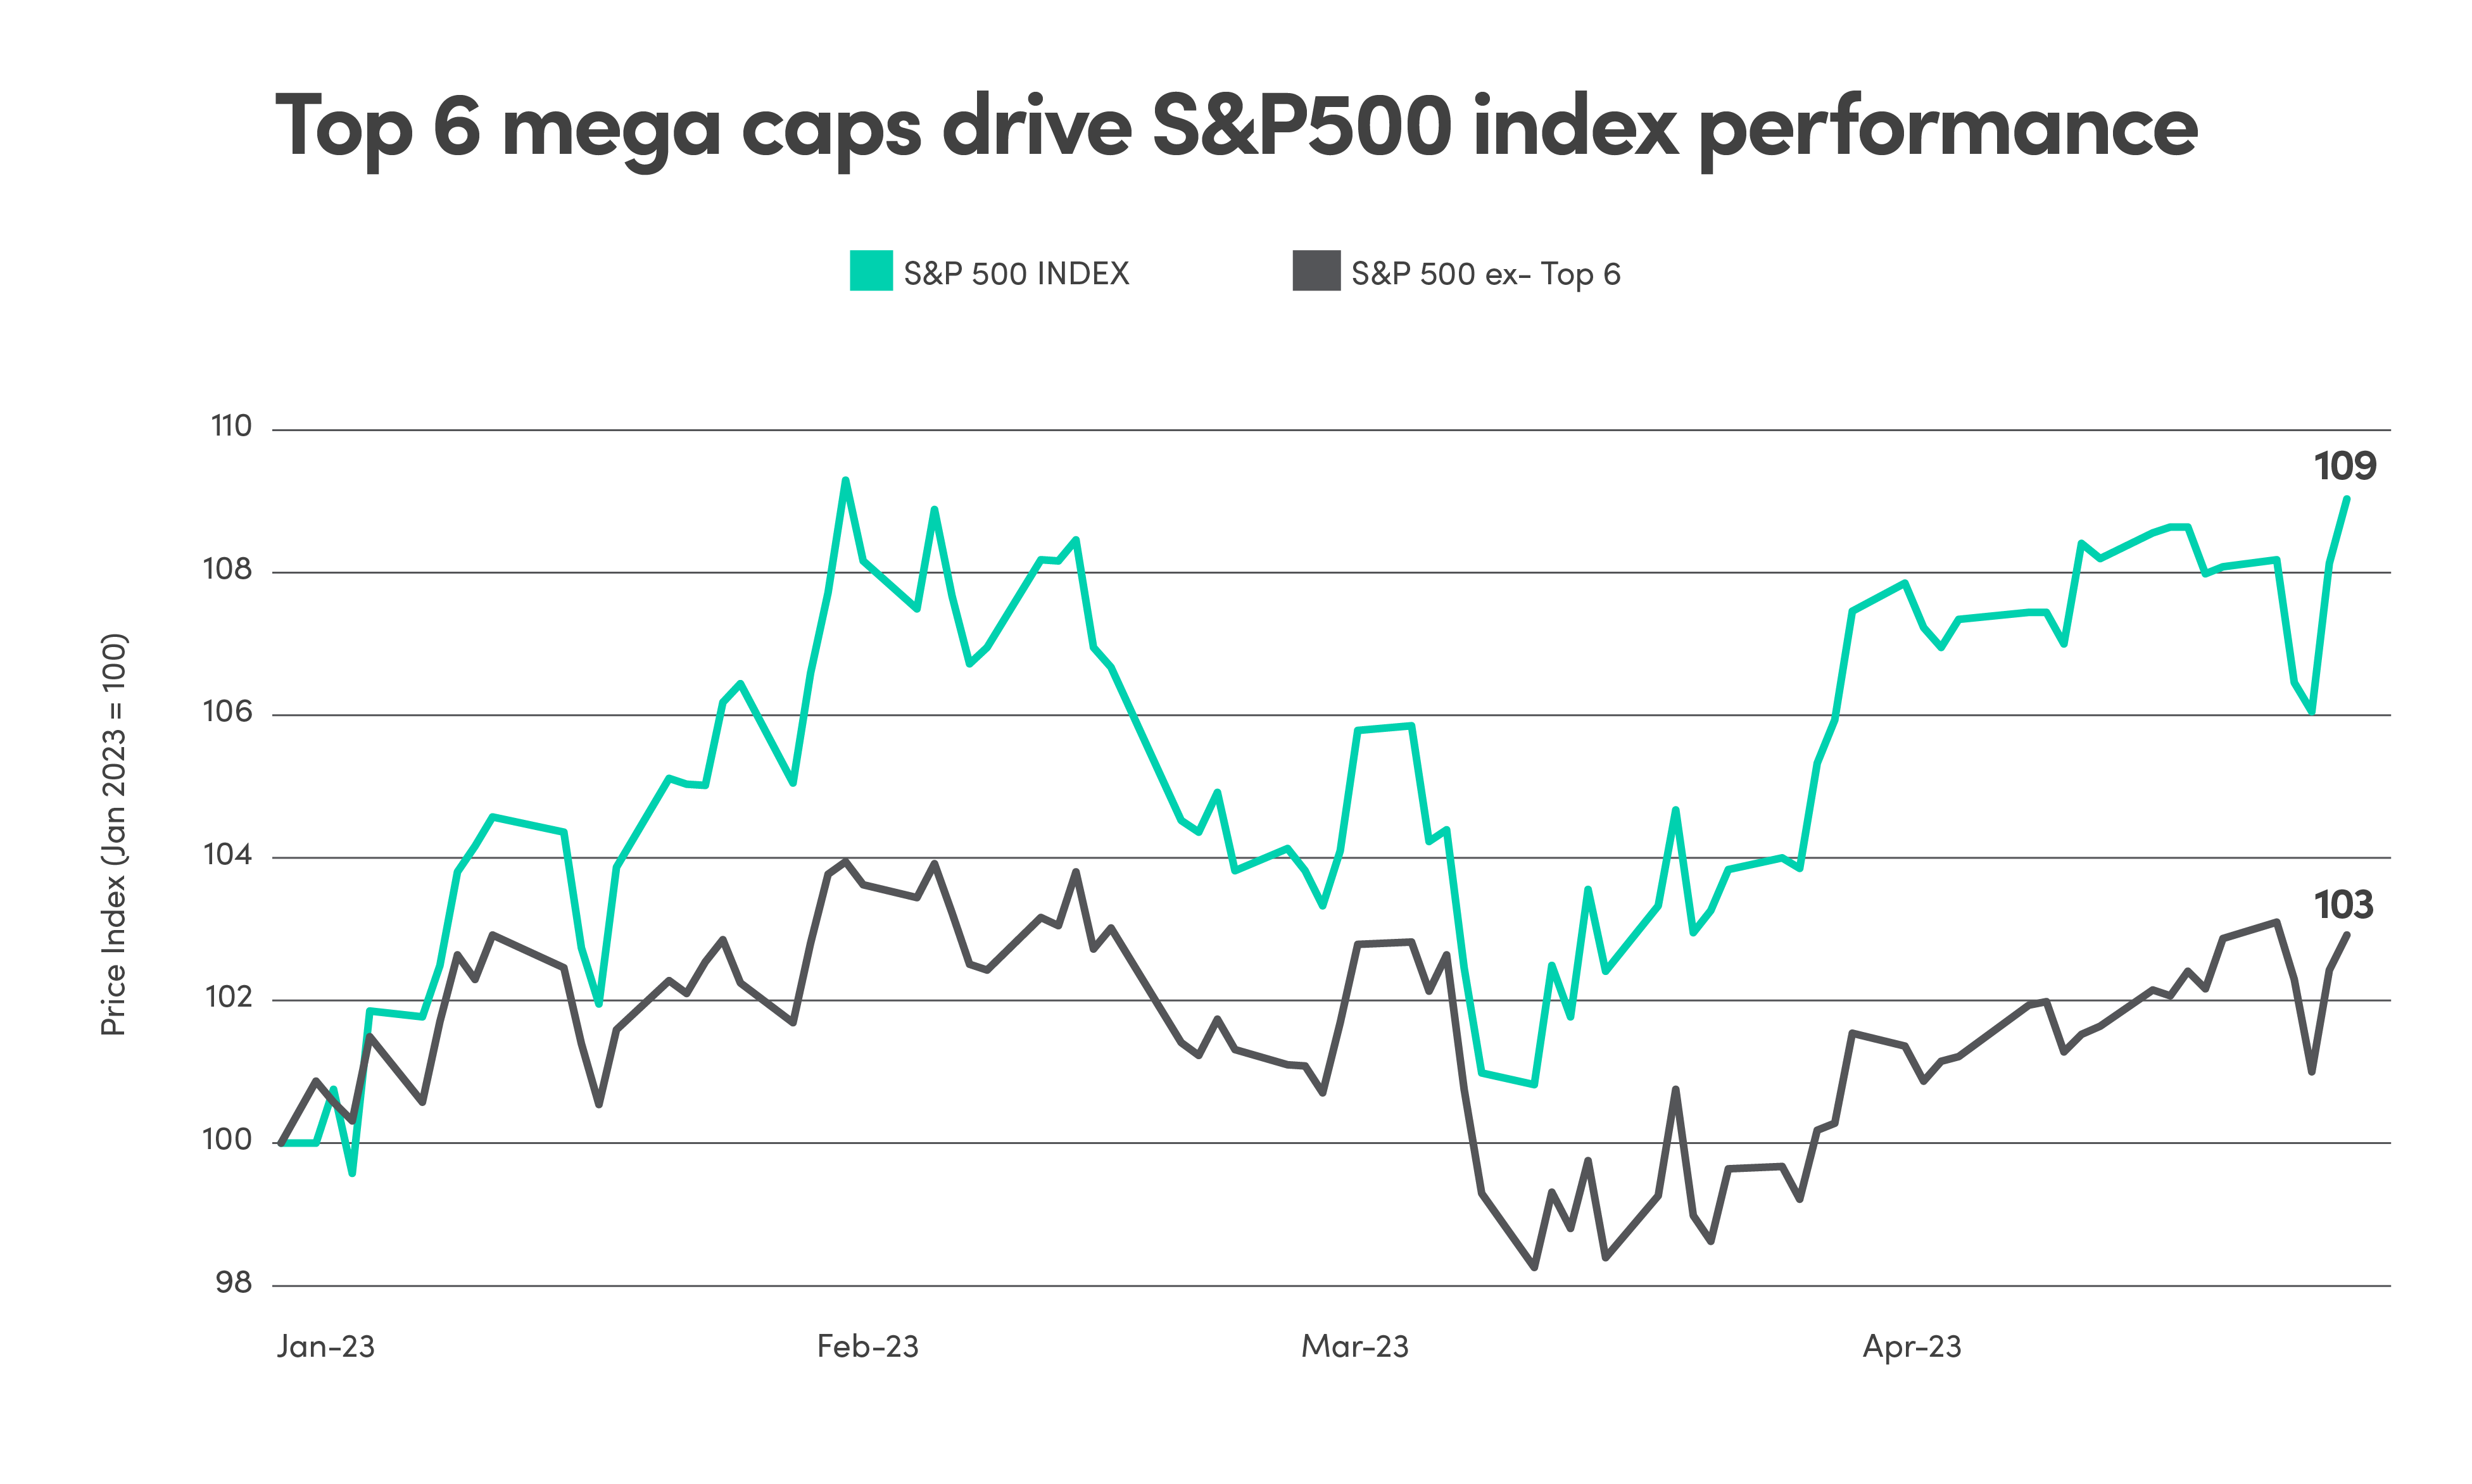
Source: Bloomberg data as of April 30, 2023

However, the effects of the aggressive monetary tightening over the past 12 months could weigh on the economy, cause consumer demand to decline, and cause credit conditions to tighten sometime between late 2023 and early 2024. These could have a significant impact on the markets, even if the economy doesn’t technically fall into a recession by definition.

Large dispersion on earnings growth between sectors

Earning expectations for Q1 2023 were set at a fairly low level following numerous downward revisions based on assumptions of a slowing economy hampered by higher rates, persistent inflation, and tapped out consumers. However, out of the 53% of S&P 500 companies that reported results by the end of April, 78% of them reported positive earnings surprise and 68% reported positive revenue surprise. The actual decline in earnings was 3.3%, versus an estimated decline in earnings of 6.7%.

However, looking at a breakdown of earnings by sector shows lots of dispersion between sectors. Of the 11 sectors in the S&P500, only 4 of them saw earnings growth over the quarter, most notably consumer discretionary, which had earnings growth at 32.6%, (skewed by standouts such as Amazon which beat estimates by 70%). Industrials had earnings growth at 21.2% and Energy had earnings growth at 14.6%. At the other end of the spectrum, materials, utilities, and health care reported negative earnings growth at -25.7%, -20.9% and -15.8% respectively.

The banking sector also proved resilient in the first quarter results despite mounting concerns about the stability of their deposit base. Most of the big U.S. banks, with the exception of Goldman Sachs, posted strong results. Smaller regional banks continue to face headwinds following the collapse of Silicon Valley Bank and Signature Bank of New York. First Republic Bank’s earnings revealed they had over US$100 billion in outflows, resulting in them being taken over by JPMorgan Chase Bank, brokered by the regulators.

Index concentration at record levels

Looking beyond sectors, the year-to-date market rally has mostly been driven by the handful of mega cap companies including Microsoft, Apple, Nvidia, Tesla, Meta, Amazon, and Alphabet. All these mega cap tech names beat estimates in Q1, with Microsoft and Meta having the strongest price performance following earnings. Nvidia had a whopping 90% price return this quarter, closely followed only by Meta at 76%. Alphabet was relatively flat following their beat and Amazon was lower the day after earnings (despite a large but brief gain in after hours) on warnings about AWS’s Q2 revenue.

As mega cap companies continue to lead the rally on the back of strong earnings, they are not only dominating on their year-to-date returns, they also having an outsized impact on the index. The top seven mega cap stocks represent a total of 22% of the S&P 500 and 47% of the Nasdaq Index’s total market cap, they also accounted for 82% of the S&P 500 Index’s year-to-date gains this year. For perspective, the 10 largest stocks in the S&P 500 now make up 26.6% of the total market cap of the index. Apple, the largest company on the S&P 500 Index, has a current market cap of C$3.6T, which is approximately 7% greater than the market cap of the entire Canadian S&P/TSX Composite Index.

As these mega cap companies continue to gain dominance in the cap-weighted S&P500 index, there are increasing concerns about concentration risk along with their rich valuations, as some names continue to climb despite lower growth expectations and falling revenues.

Line graph comparing the S&P 500 Index performance with and without the top 6 mega cap companies, from January 2023 to April 2023

Source: Bloomberg data as of March 31, 2023

Aviso Wealth logo

Aviso Wealth Inc. (“Aviso Wealth”) is the parent company of Credential Qtrade Securities Inc. (“CQSI”), Credential Asset Management (“CAM”), Qtrade Asset Management (“QAM”) and Northwest & Ethical Investments L.P. (“NEI”). NEI Investments is a registered trademark of NEI. Any use by CQSI, CAM, QAM or NEI of an Aviso Wealth trade name or trademark is made with the consent and/or license of Aviso Wealth. Aviso Wealth is a wholly-owned subsidiary of Aviso Wealth Limited Partnership, which in turn is owned 50% by Desjardins Financial Holdings Inc. and 50% by a limited partnership owned by the five Provincial Credit Union Centrals and The CUMIS Group Limited.

This material is for informational and educational purposes and it is not intended to provide specific advice including, without limitation, investment, financial, tax or similar matters. This document is published by CQSI, CAM and QAM and unless indicated otherwise, all views expressed in this document are those of CQSI, CAM and QAM. The views expressed herein are subject to change without notice as markets change over time. Views expressed regarding a particular industry or market sector should not be considered an indication of trading intent of any funds managed by NEI Investments. Forward-looking statements are not guaranteed of future performance and risks and uncertainties often cause actual results to differ materially from forward-looking information or expectations. Do not place undue reliance on forward-looking information. Mutual funds are offered through Credential Asset Management Inc. Mutual funds and other securities are offered through Credential Qtrade Securities Inc. Commissions, trailing commissions, management fees and expenses all may be associated with mutual fund investments. Please read the prospectus before investing. Unless otherwise stated, mutual fund securities and cash balances are not insured nor guaranteed, their values change frequently and past performance may not be repeated.

The MSCI information may only be used for your internal use, may not be reproduced or re-disseminated in any form and may not be used as a basis for or a component of any financial instruments or products or indices. None of the MSCI information is intended to constitute investment advice or a recommendation to make (or refrain from making) any kind of investment decision and may not be relied on as such. Historical data and analysis should not be taken as an indication or guarantee of any future performance, analysis, forecast or prediction. The MSSCI information is provided on an “as is” basis and the user of this information assumes the entire risk of any use made of this information. MSCI, each of its affiliates and each other person involved in or related to computing, computing or creating any MSCI information (collectively, the “MSCI Parties”) expressly disclaims all warranties (including, without limitation, any warranties of originality, accuracy, completeness, timeliness, non-infringement, merchantability and fitness for a particular purpose) with respect to this information. Without limiting any of the foregoing, in no event shall any MSCI Party have any liability for any direct, indirect, special, incidental, punitive, consequential (including, without limitation, lost profits) or any other damages.